


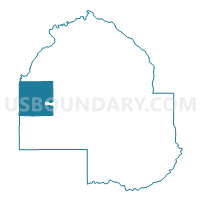
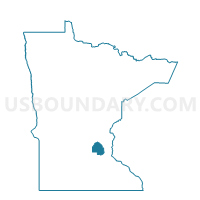
Independence city, Hennepin County, Minnesota
About
Outline

Summary
| Unique Area Identifier | 137298 |
| Name | Independence city |
| County | Hennepin County |
| State | Minnesota |
| Area (square miles) | 34.56 |
| Land Area (square miles) | 32.37 |
| Water Area (square miles) | 2.19 |
| % of Land Area | 93.66 |
| % of Water Area | 6.34 |
| Latitude of the Internal Point | 45.01807490 |
| Longtitude of the Internal Point | -93.71941460 |
| Total Population | 3,504 |
| Total Housing Units | 1,305 |
| Total Households | 1,241 |
| Median Age | 45.6 |
Maps
Graphs
Select a template below for downloading or customizing gragh for Independence city, Hennepin County, Minnesota


Neighbors
Neighoring County Subdivision (by Name) Neighboring County Subdivision on the Map
- Corcoran city, Hennepin County, MN
- Delano city, Wright County, MN
- Franklin township, Wright County, MN
- Greenfield city, Hennepin County, MN
- Maple Plain city, Hennepin County, MN
- Medina city, Hennepin County, MN
- Minnetrista city, Hennepin County, MN
- Orono city, Hennepin County, MN
- Watertown township, Carver County, MN
Top 10 Neighboring Place (by Population) Neighboring Place on the Map
- Orono city, MN (7,437)
- Minnetrista city, MN (6,384)
- Delano city, MN (5,464)
- Corcoran city, MN (5,379)
- Medina city, MN (4,892)
- Independence city, MN (3,504)
- Greenfield city, MN (2,777)
- Maple Plain city, MN (1,768)
Top 10 Neighboring Unified School District (by Population) Neighboring Unified School District on the Map
- Westonka Public School District, MN (17,780)
- Orono Public School District, MN (11,947)
- Delano Public School District, MN (10,937)
- Rockford Public School District, MN (9,462)
- Watertown-Mayer Public School District, MN (9,461)
Top 10 Neighboring State Legislative District Lower Chamber (by Population) Neighboring State Legislative District Lower Chamber on the Map
- State House District 19B, MN (59,068)
- State House District 32A, MN (55,517)
- State House District 34A, MN (47,533)
- State House District 33A, MN (39,836)
- State House District 33B, MN (35,276)
Top 10 Neighboring State Legislative District Upper Chamber (by Population) Neighboring State Legislative District Upper Chamber on the Map
- State Senate District 19, MN (106,452)
- State Senate District 34, MN (94,255)
- State Senate District 32, MN (90,959)
- State Senate District 33, MN (75,112)
Top 10 Neighboring 111th Congressional District (by Population) Neighboring 111th Congressional District on the Map
- Congressional District 6, MN (759,478)
- Congressional District 2, MN (732,515)
- Congressional District 3, MN (650,185)
Top 10 Neighboring Census Tract (by Population) Neighboring Census Tract on the Map
- Census Tract 277, Hennepin County, MN (8,667)
- Census Tract 1010, Wright County, MN (8,224)
- Census Tract 272.01, Hennepin County, MN (6,166)
- Census Tract 271.01, Hennepin County, MN (5,542)
- Census Tract 901, Carver County, MN (5,507)
- Census Tract 271.02, Hennepin County, MN (5,402)
- Census Tract 270.02, Hennepin County, MN (5,272)
- Census Tract 270.01, Hennepin County, MN (3,203)
Top 10 Neighboring 5-Digit ZIP Code Tabulation Area (by Population) Neighboring 5-Digit ZIP Code Tabulation Area on the Map
Explore Neighbors on the MapData
Demographic, Population, Households, and Housing Units
** Data sources from census 2010 **
Show Data on Map
Download Full List as CSV
Download Quick Sheet as CSV
| Subject | This Area | Hennepin County | Minnesota | National |
|---|---|---|---|---|
| POPULATION | ||||
| Total Population Map | 3,504 | 1,152,425 | 5,303,925 | 308,745,538 |
| POPULATION, HISPANIC OR LATINO ORIGIN | ||||
| Not Hispanic or Latino Map | 3,457 | 1,074,749 | 5,053,667 | 258,267,944 |
| Hispanic or Latino Map | 47 | 77,676 | 250,258 | 50,477,594 |
| POPULATION, RACE | ||||
| White alone Map | 3,404 | 856,834 | 4,524,062 | 223,553,265 |
| Black or African American alone Map | 9 | 136,262 | 274,412 | 38,929,319 |
| American Indian and Alaska Native alone Map | 12 | 10,591 | 60,916 | 2,932,248 |
| Asian alone Map | 37 | 71,905 | 214,234 | 14,674,252 |
| Native Hawaiian and Other Pacific Islander alone Map | 0 | 506 | 2,156 | 540,013 |
| Some Other Race alone Map | 7 | 38,878 | 103,000 | 19,107,368 |
| Two or More Races Map | 35 | 37,449 | 125,145 | 9,009,073 |
| POPULATION, SEX | ||||
| Male Map | 1,783 | 566,184 | 2,632,132 | 151,781,326 |
| Female Map | 1,721 | 586,241 | 2,671,793 | 156,964,212 |
| POPULATION, AGE (18 YEARS) | ||||
| 18 years and over Map | 2,584 | 891,080 | 4,019,862 | 234,564,071 |
| Under 18 years | 920 | 261,345 | 1,284,063 | 74,181,467 |
| POPULATION, AGE | ||||
| Under 5 years | 109 | 76,236 | 355,504 | 20,201,362 |
| 5 to 9 years | 267 | 72,409 | 355,536 | 20,348,657 |
| 10 to 14 years | 332 | 69,348 | 352,342 | 20,677,194 |
| 15 to 17 years | 212 | 43,352 | 220,681 | 12,954,254 |
| 18 and 19 years | 85 | 29,320 | 147,148 | 9,086,089 |
| 20 years | 15 | 15,434 | 72,732 | 4,519,129 |
| 21 years | 26 | 15,335 | 70,594 | 4,354,294 |
| 22 to 24 years | 78 | 53,462 | 212,325 | 12,712,576 |
| 25 to 29 years | 80 | 100,913 | 372,686 | 21,101,849 |
| 30 to 34 years | 73 | 86,610 | 342,900 | 19,962,099 |
| 35 to 39 years | 127 | 76,196 | 328,190 | 20,179,642 |
| 40 to 44 years | 302 | 78,108 | 352,904 | 20,890,964 |
| 45 to 49 years | 424 | 85,932 | 406,203 | 22,708,591 |
| 50 to 54 years | 416 | 85,198 | 401,695 | 22,298,125 |
| 55 to 59 years | 283 | 74,853 | 349,589 | 19,664,805 |
| 60 and 61 years | 87 | 25,830 | 120,761 | 7,113,727 |
| 62 to 64 years | 151 | 33,075 | 159,014 | 9,704,197 |
| 65 and 66 years | 78 | 16,854 | 86,158 | 5,319,902 |
| 67 to 69 years | 104 | 21,826 | 116,412 | 7,115,361 |
| 70 to 74 years | 103 | 27,836 | 151,857 | 9,278,166 |
| 75 to 79 years | 78 | 22,626 | 122,114 | 7,317,795 |
| 80 to 84 years | 52 | 19,850 | 99,916 | 5,743,327 |
| 85 years and over | 22 | 21,822 | 106,664 | 5,493,433 |
| MEDIAN AGE BY SEX | ||||
| Both sexes Map | 45.60 | 35.90 | 37.40 | 37.20 |
| Male Map | 45.60 | 34.90 | 36.30 | 35.80 |
| Female Map | 45.50 | 36.90 | 38.40 | 38.50 |
| HOUSEHOLDS | ||||
| Total Households Map | 1,241 | 475,913 | 2,087,227 | 116,716,292 |
| HOUSEHOLDS, HOUSEHOLD TYPE | ||||
| Family households: Map | 1,009 | 272,885 | 1,349,015 | 77,538,296 |
| Husband-wife family Map | 919 | 205,183 | 1,060,509 | 56,510,377 |
| Other family: Map | 90 | 67,702 | 288,506 | 21,027,919 |
| Male householder, no wife present Map | 36 | 18,513 | 89,707 | 5,777,570 |
| Female householder, no husband present Map | 54 | 49,189 | 198,799 | 15,250,349 |
| Nonfamily households: Map | 232 | 203,028 | 738,212 | 39,177,996 |
| Householder living alone Map | 185 | 155,807 | 584,008 | 31,204,909 |
| Householder not living alone Map | 47 | 47,221 | 154,204 | 7,973,087 |
| HOUSEHOLDS, HISPANIC OR LATINO ORIGIN OF HOUSEHOLDER | ||||
| Not Hispanic or Latino householder: Map | 1,232 | 457,061 | 2,027,489 | 103,254,926 |
| Hispanic or Latino householder: Map | 9 | 18,852 | 59,738 | 13,461,366 |
| HOUSEHOLDS, RACE OF HOUSEHOLDER | ||||
| Householder who is White alone | 1,219 | 385,690 | 1,870,205 | 89,754,352 |
| Householder who is Black or African American alone | 0 | 47,969 | 90,187 | 14,129,983 |
| Householder who is American Indian and Alaska Native alone | 5 | 3,296 | 19,078 | 939,707 |
| Householder who is Asian alone | 9 | 21,558 | 57,475 | 4,632,164 |
| Householder who is Native Hawaiian and Other Pacific Islander alone | 0 | 155 | 603 | 143,932 |
| Householder who is Some Other Race alone | 2 | 8,925 | 24,853 | 4,916,427 |
| Householder who is Two or More Races | 6 | 8,320 | 24,826 | 2,199,727 |
| HOUSEHOLDS, HOUSEHOLD TYPE BY HOUSEHOLD SIZE | ||||
| Family households: Map | 1,009 | 272,885 | 1,349,015 | 77,538,296 |
| 2-person household Map | 431 | 119,446 | 602,770 | 31,882,616 |
| 3-person household Map | 196 | 61,414 | 289,028 | 17,765,829 |
| 4-person household Map | 243 | 53,627 | 265,265 | 15,214,075 |
| 5-person household Map | 92 | 22,666 | 119,947 | 7,411,997 |
| 6-person household Map | 31 | 8,463 | 43,372 | 3,026,278 |
| 7-or-more-person household Map | 16 | 7,269 | 28,633 | 2,237,501 |
| Nonfamily households: Map | 232 | 203,028 | 738,212 | 39,177,996 |
| 1-person household Map | 185 | 155,807 | 584,008 | 31,204,909 |
| 2-person household Map | 44 | 37,417 | 121,616 | 6,360,012 |
| 3-person household Map | 1 | 5,968 | 18,766 | 992,156 |
| 4-person household Map | 2 | 2,581 | 9,356 | 411,171 |
| 5-person household Map | 0 | 850 | 3,055 | 126,634 |
| 6-person household Map | 0 | 234 | 886 | 48,421 |
| 7-or-more-person household Map | 0 | 171 | 525 | 34,693 |
| HOUSING UNITS | ||||
| Total Housing Units Map | 1,305 | 509,469 | 2,347,201 | 131,704,730 |
| HOUSING UNITS, OCCUPANCY STATUS | ||||
| Occupied Map | 1,241 | 475,913 | 2,087,227 | 116,716,292 |
| Vacant Map | 64 | 33,556 | 259,974 | 14,988,438 |
| HOUSING UNITS, OCCUPIED, TENURE | ||||
| Owned with a mortgage or a loan Map | 876 | 239,686 | 1,109,405 | 52,979,430 |
| Owned free and clear Map | 286 | 66,435 | 414,454 | 23,006,644 |
| Renter occupied Map | 79 | 169,792 | 563,368 | 40,730,218 |
| HOUSING UNITS, VACANT, VACANCY STATUS | ||||
| For rent Map | 4 | 13,951 | 48,091 | 4,137,567 |
| Rented, not occupied Map | 0 | 973 | 3,198 | 206,825 |
| For sale only Map | 19 | 6,571 | 30,726 | 1,896,796 |
| Sold, not occupied Map | 3 | 1,392 | 6,232 | 421,032 |
| For seasonal, recreational, or occasional use Map | 16 | 4,168 | 130,471 | 4,649,298 |
| For migrant workers Map | 0 | 9 | 334 | 24,161 |
| Other vacant Map | 22 | 6,492 | 40,922 | 3,652,759 |
| HOUSING UNITS, OCCUPIED, AVERAGE HOUSEHOLD SIZE BY TENURE | ||||
| Total: Map | 2.80 | 2.37 | 2.48 | 2.58 |
| Owner occupied Map | 2.84 | 2.51 | 2.59 | 2.65 |
| Renter occupied Map | 2.23 | 2.12 | 2.16 | 2.44 |
| HOUSING UNITS, OCCUPIED, TENURE BY RACE OF HOUSEHOLDER | ||||
| Owner occupied: Map | 1,162 | 306,121 | 1,523,859 | 75,986,074 |
| Householder who is White alone Map | 1,145 | 276,258 | 1,437,173 | 63,446,275 |
| Householder who is Black or African American alone Map | 0 | 11,464 | 22,968 | 6,261,464 |
| Householder who is American Indian and Alaska Native alone Map | 5 | 1,027 | 9,155 | 509,588 |
| Householder who is Asian alone Map | 7 | 11,282 | 32,562 | 2,688,861 |
| Householder who is Native Hawaiian and Other Pacific Islander alone Map | 0 | 71 | 308 | 61,911 |
| Householder who is Some Other Race alone Map | 1 | 2,687 | 9,816 | 1,975,817 |
| Householder who is Two or More Races Map | 4 | 3,332 | 11,877 | 1,042,158 |
| Renter occupied: Map | 79 | 169,792 | 563,368 | 40,730,218 |
| Householder who is White alone Map | 74 | 109,432 | 433,032 | 26,308,077 |
| Householder who is Black or African American alone Map | 0 | 36,505 | 67,219 | 7,868,519 |
| Householder who is American Indian and Alaska Native alone Map | 0 | 2,269 | 9,923 | 430,119 |
| Householder who is Asian alone Map | 2 | 10,276 | 24,913 | 1,943,303 |
| Householder who is Native Hawaiian and Other Pacific Islander alone Map | 0 | 84 | 295 | 82,021 |
| Householder who is Some Other Race alone Map | 1 | 6,238 | 15,037 | 2,940,610 |
| Householder who is Two or More Races Map | 2 | 4,988 | 12,949 | 1,157,569 |
| HOUSING UNITS, OCCUPIED, TENURE BY HISPANIC OR LATINO ORIGIN OF HOUSEHOLDER | ||||
| Owner occupied: Map | 1,162 | 306,121 | 1,523,859 | 75,986,074 |
| Not Hispanic or Latino householder Map | 1,159 | 299,551 | 1,497,368 | 69,617,625 |
| Hispanic or Latino householder Map | 3 | 6,570 | 26,491 | 6,368,449 |
| Renter occupied: Map | 79 | 169,792 | 563,368 | 40,730,218 |
| Not Hispanic or Latino householder Map | 73 | 157,510 | 530,121 | 33,637,301 |
| Hispanic or Latino householder Map | 6 | 12,282 | 33,247 | 7,092,917 |
| HOUSING UNITS, OCCUPIED, TENURE BY HOUSEHOLD SIZE | ||||
| Owner occupied: Map | 1,162 | 306,121 | 1,523,859 | 75,986,074 |
| 1-person household Map | 157 | 77,198 | 329,955 | 16,453,569 |
| 2-person household Map | 448 | 112,157 | 581,481 | 27,618,605 |
| 3-person household Map | 186 | 47,338 | 236,596 | 12,517,563 |
| 4-person household Map | 239 | 42,878 | 224,564 | 10,998,793 |
| 5-person household Map | 87 | 16,863 | 98,018 | 5,057,765 |
| 6-person household Map | 29 | 5,442 | 33,229 | 1,965,796 |
| 7-or-more-person household Map | 16 | 4,245 | 20,016 | 1,373,983 |
| Renter occupied: Map | 79 | 169,792 | 563,368 | 40,730,218 |
| 1-person household Map | 28 | 78,609 | 254,053 | 14,751,340 |
| 2-person household Map | 27 | 44,706 | 142,905 | 10,624,023 |
| 3-person household Map | 11 | 20,044 | 71,198 | 6,240,422 |
| 4-person household Map | 6 | 13,330 | 50,057 | 4,626,453 |
| 5-person household Map | 5 | 6,653 | 24,984 | 2,480,866 |
| 6-person household Map | 2 | 3,255 | 11,029 | 1,108,903 |
| 7-or-more-person household Map | 0 | 3,195 | 9,142 | 898,211 |
Loading...